Heart and metabolic analysis
Using CDC data and established cardiovascular guidance, Nexametry presents heart and metabolic information through clear comparisons and accessible explanations.
Nexametry is a health and lifestyle platform that makes complex information easier to understand and use through public-health datasets, interactive analysis, established calculators, relevant research, and practical guides.
An Appalore platform
Health information comes in many forms: population datasets, clinical tools, research papers, measurements, devices, and everyday observations. Each has a purpose, a population, and limits.
Nexametry turns those materials into easy-to-understand visuals, graph-rich analysis, and layered data exploration—from a top-level result to its component factors, assumptions, and underlying data—while keeping source, date, scope, and limitations visible.
Nexametry uses public data, established tools, and research to clarify what a measure can show—and what it cannot say about an individual.
Using CDC data and established cardiovascular guidance, Nexametry presents heart and metabolic information through clear comparisons and accessible explanations.
Fat, lean, and bone mass change independently, but a body-fat percentage can move without any fat being lost. Nexametry keeps the underlying quantities visible.
See how a continuous glucose monitor is applied, what the sensor measures, what appears in the app, how readings change through the day, and what the first few days are like. Meals and activity can appear alongside the trace without treating one spike or pattern as a diagnosis.
Bring physical function, mobility, cognition, social connection, mood, purpose, and quality of life into a broader view of aging, while distinguishing research, personal reflection, and clinical assessment.
Nutrition data and practical instruction make food easier to compare, prepare, and enjoy—without reducing meals to a score or presenting editorial judgment as medical evidence.
Strawberries and mango are both whole fruits. The useful comparison is serving size, total sugar, fiber, energy, preparation, and how each choice fits the broader eating pattern.

Compare total and added sugars, fiber, serving size, glycemic index, and the wider meal rather than relying on a single number.
Show how preparation changes the picture. Juice can make a larger amount easier to consume quickly and may provide less fiber than the whole fruit.
Separate saturated and unsaturated fats, explain why that balance matters when viewing LDL cholesterol, and keep the wider dietary pattern and clinical context visible.
Carbohydrate commonly contributes about 4 calories per gram and fat about 9. Clear arithmetic can explain a meal without turning it into a moral score.
Front-and-back body views can turn a workout list into an understandable map of muscle groups, movement patterns, and training coverage over time.
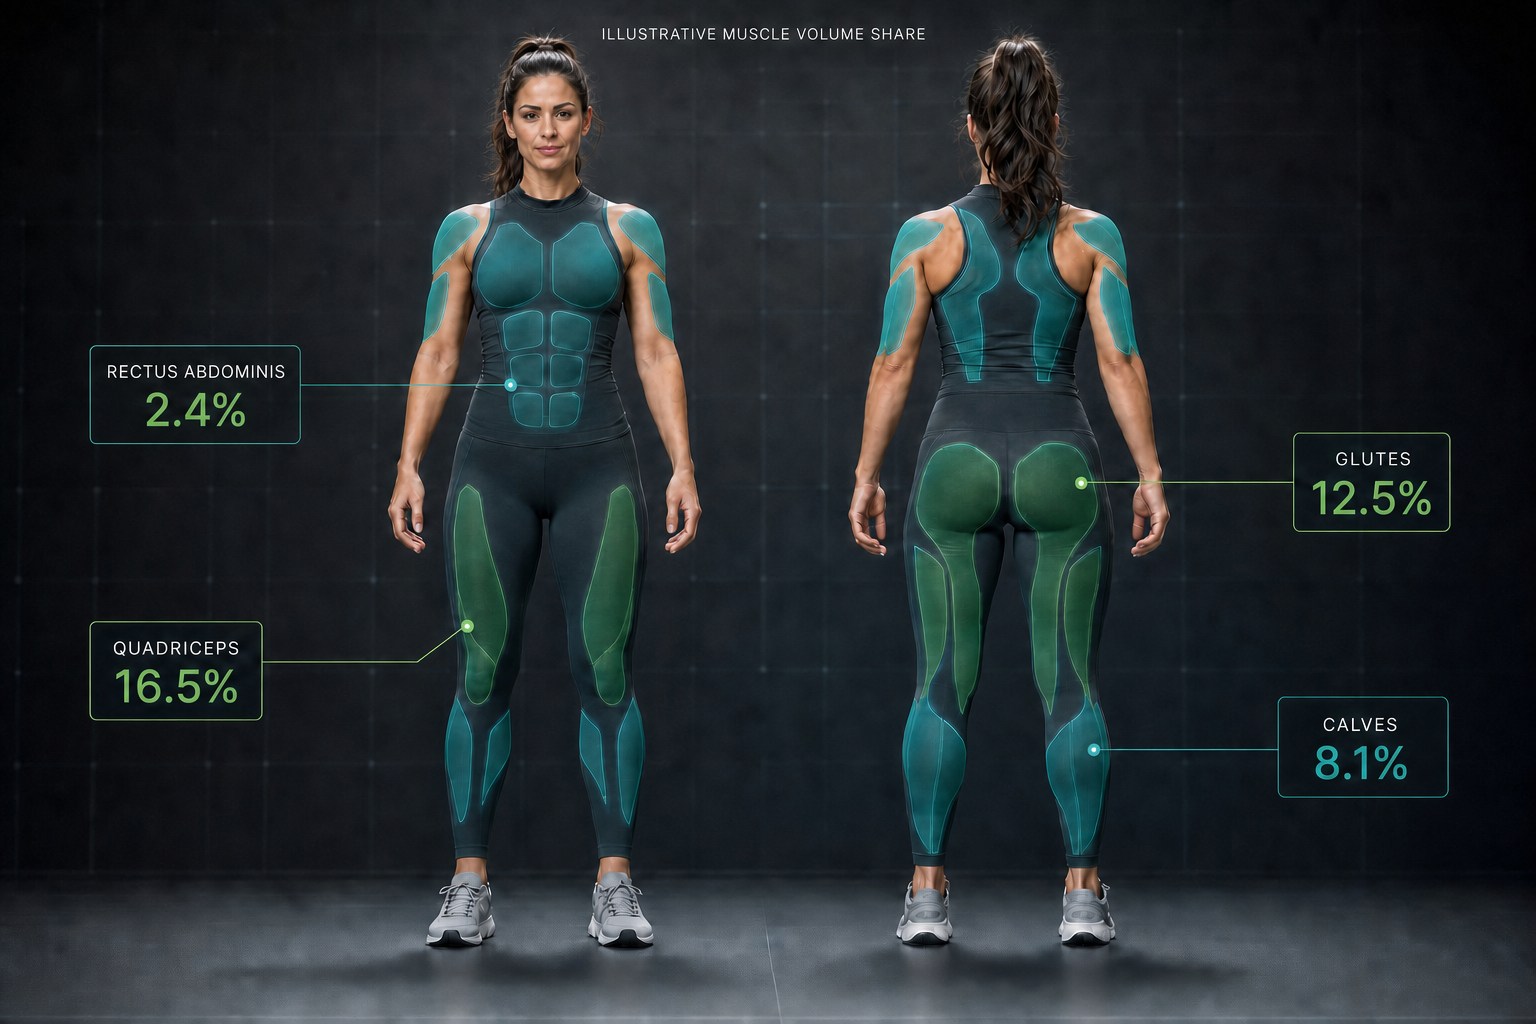
Tools and tips that complete a health, diet, or fitness habit — what to use, what to swap, and what is worth avoiding — each backed by research and analysis.
Nexametry applies Appalore’s shared visual and analytical framework to health and lifestyle, adapting it to public data, research, measurements, devices, and everyday choices.
This page presents the framework: organize diverse material, show where it came from, and make the result useful to a non-specialist.
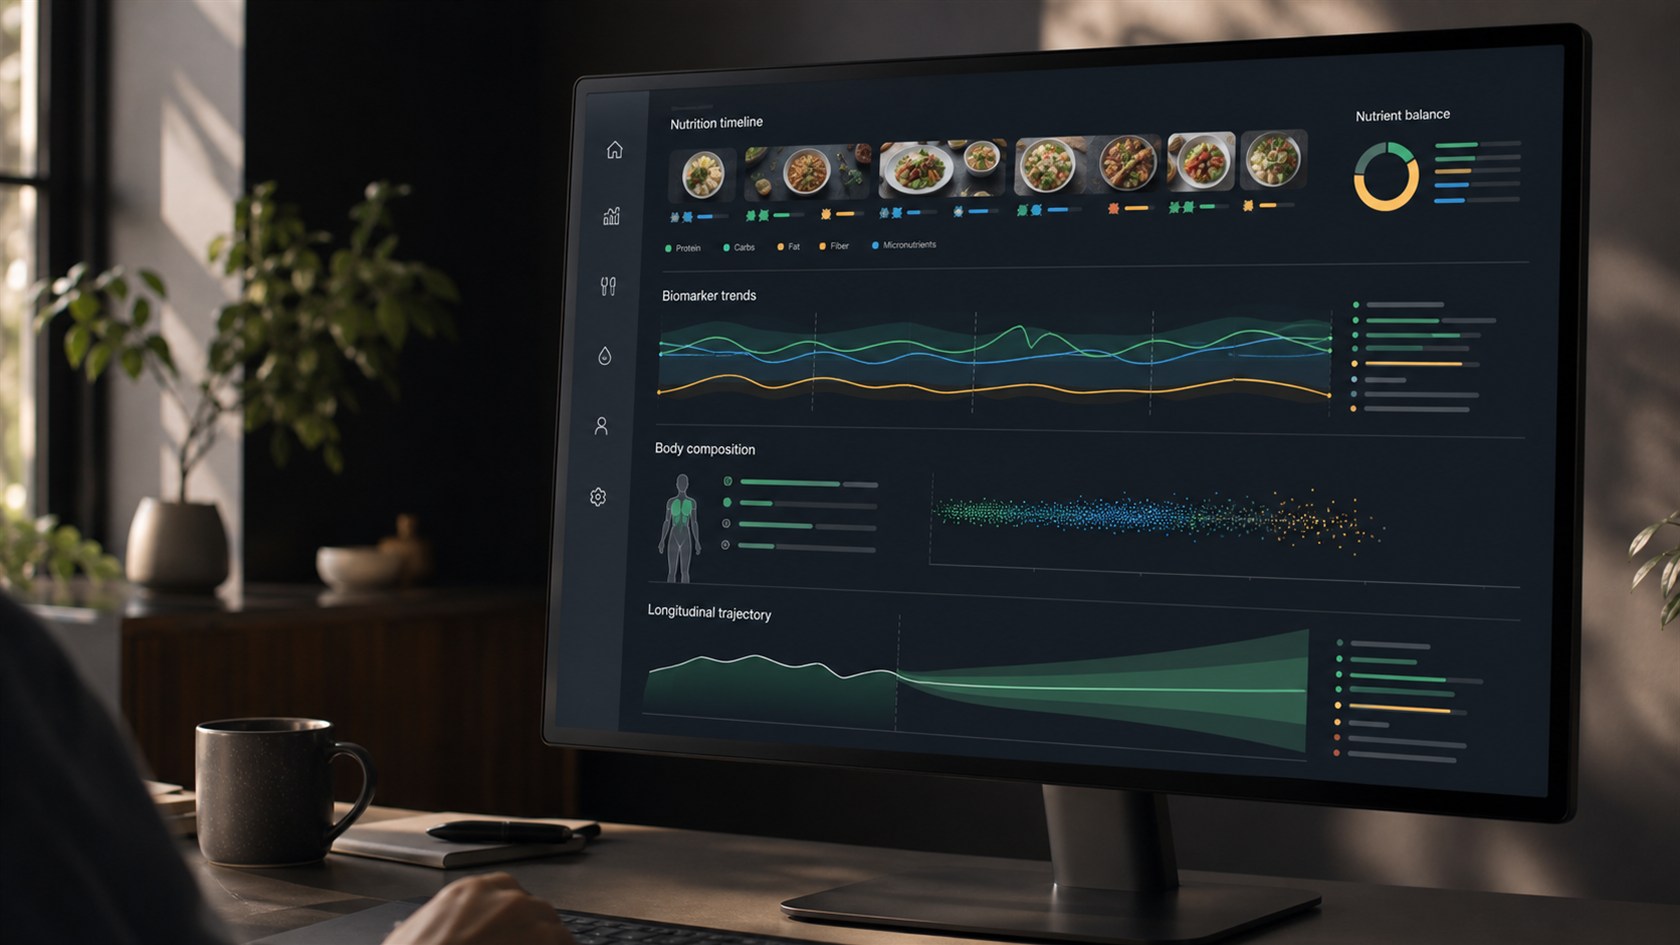
Tell us about a dataset, measurement, device, paper, or everyday decision you want to examine through Nexametry.
Tell us about a health dataset, analytical question, measurement, device, or practical guide you want to explore.
Include the question, source, tool, or everyday choice that interests you.
Email AppaloreEvery message is routed to a real person. We do not use automated bot replies.